7 Analytics Tools For eCommerce Website Analysis in 2024

Running in a competitive eCommerce market requires more than just an attractive website and competitive pricing. It's about using the right analytics tools to understand your customers' behavior, optimize their shopping experience, and drive sales. This year, 2024, has seen the emergence of various cutting-edge analytics tools designed specifically for eCommerce websites. These tools offer deeper insights into user interactions and provide actionable data to improve your digital strategies.
While bounce and exit rates, average order value, checkout flow, conversion rates, etc. metrics are valuable for understanding your site's performance and user behavior, they often leave many critical questions unanswered:
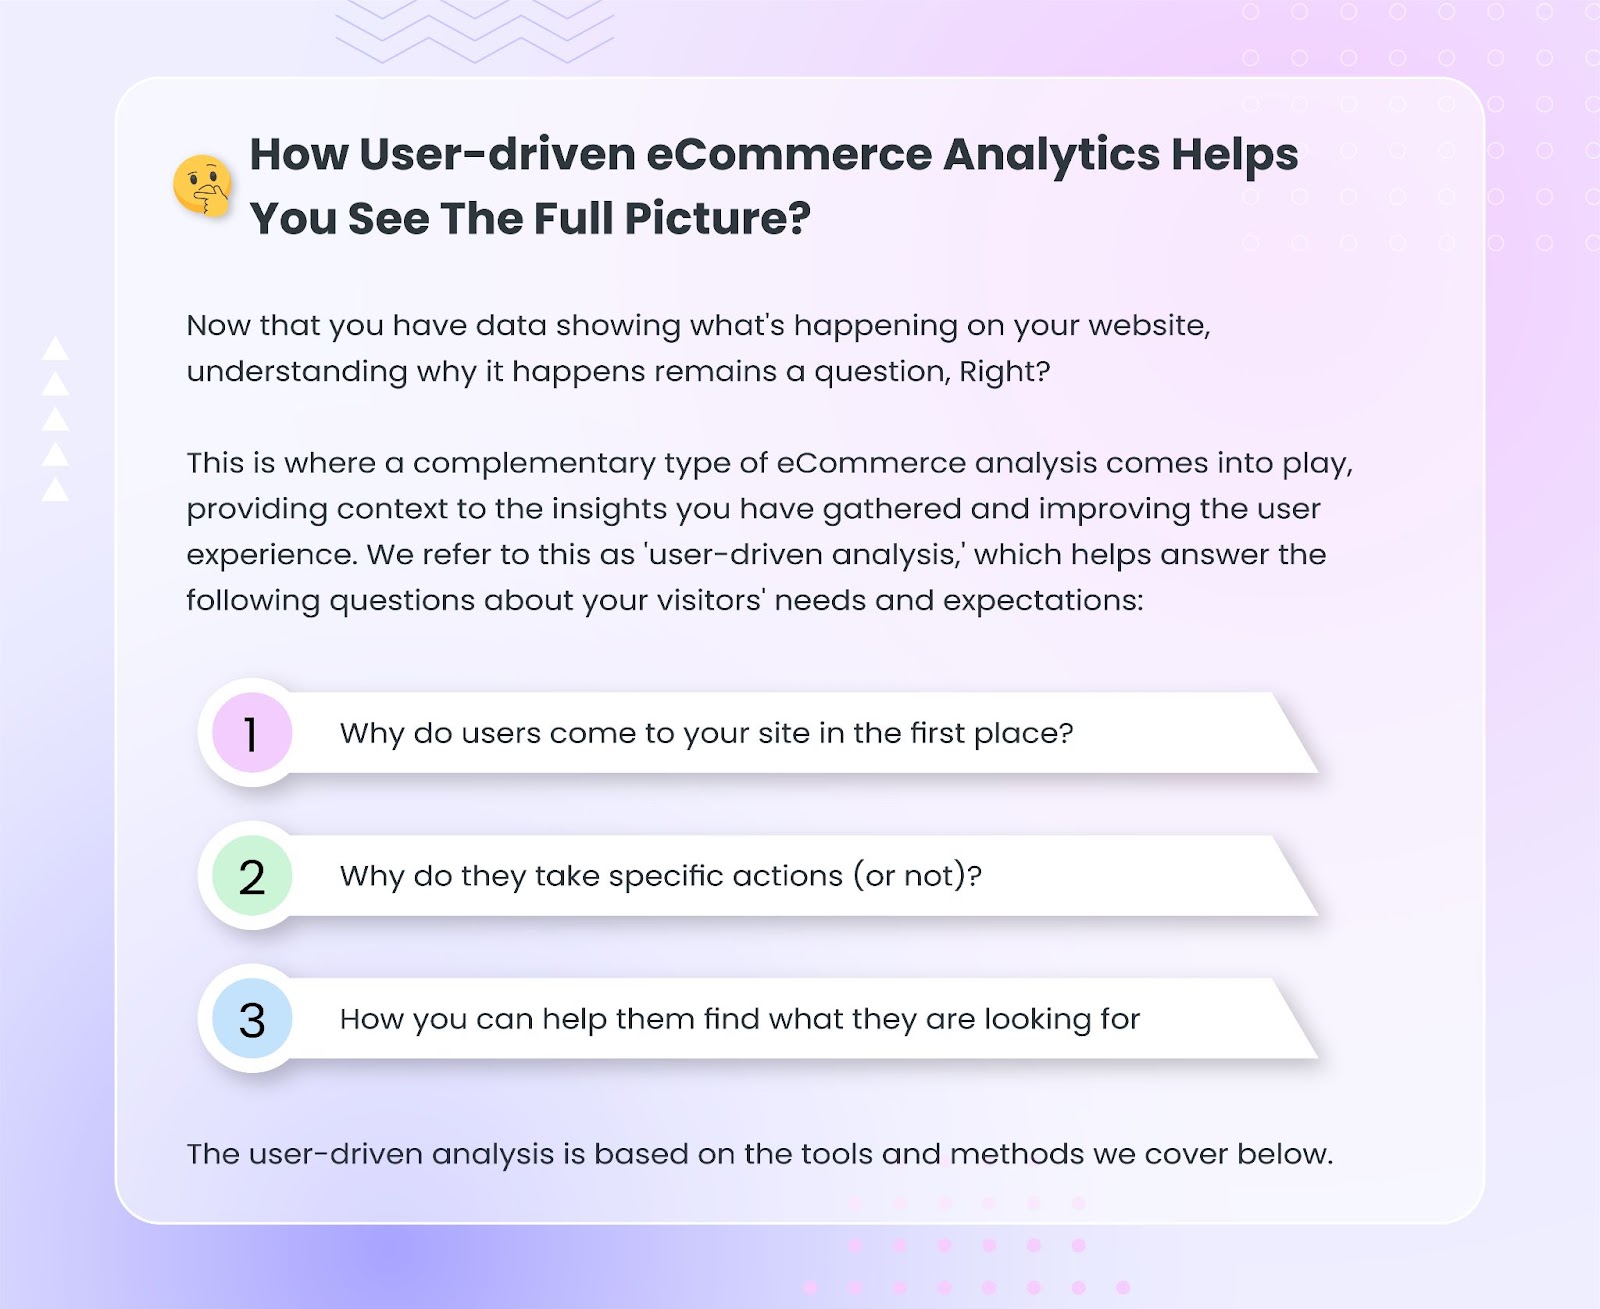
✅ Why are visitors coming to my site? What attracted them here?
✅ Why aren’t they clicking the CTA on our product page?
✅ What are they searching for? How can we help them find it?
✅ Why are so many people just adding products to the cart but not completing the purchase?
Traditional quantitative analysis methods alone can't fully address these questions. However, a user-driven approach, which involves analyzing your site from the user's perspective, can provide in-depth insights.
click here to get the answer
eCommerce Metrics You Need To Monitor On Your Website
1. Bounce rates
The bounce rate represents the proportion of visits where users leave your site without engaging further, such as clicking on links, navigating to other pages, or interacting with calls to action (CTAs).
For an eCommerce site, success hinges on users progressing through multiple pages, such as navigating from the homepage to the product page, adding items to the shopping cart, and completing the checkout process. A high bounce rate on key pages, like the homepage, can signal issues that need to be addressed, possibly related to design flaws or poor user experience (UX).
A Key Consideration:
It serves as a preliminary indicator for in-depth analysis of user behavior. When examining bounce rates, it's important to consider the broader context and use this metric to investigate further how visitors interact with your site.
2. Exit rates
Exit rate measures the frequency users leave your site after viewing one or more pages.
Tracking exit rates can provide insights into how well specific pages are performing. High exit rates on certain pages might indicate usability problems. For example, if the last page of your sales funnel, such as the checkout or payment page, has a high exit rate, it could suggest issues that deter visitors from completing their purchases.
A Key Consideration:
Since most visitors will eventually leave your site, this metric alone doesn’t explain why they choose to exit when they actually want to buy a product. It should be used as a starting point for in-depth analysis of user behavior to identify potential problems and areas for improvement.
3. Average order value (AOV)
Average Order Value (AOV) calculates the average sum spent per transaction in your online store over a specific period.
Tracking AOV provides valuable insights for strategic decisions related to advertising budgets, pricing strategies, and marketing campaigns such as upselling, cross-selling, and special promotions or offerings. Knowing your site’s AOV can also prompt considerations for conversion rate optimization (CRO), potentially leading to improvement in user experience (UX) through redesigns or improvements in the shop layout.
A Key Consideration:
While AOV is a metric for assessing the effectiveness of sales strategies, it should not be viewed in isolation. It's essential to analyze it alongside other metrics, such as customer lifetime value (CLV) and conversion rates, to understand your business performance comprehensively. Additionally, sudden changes in AOV might indicate shifts in customer behavior or external factors affecting purchasing patterns, necessitating further investigation.
7 Analytics Tools For eCommerce Website Analysis
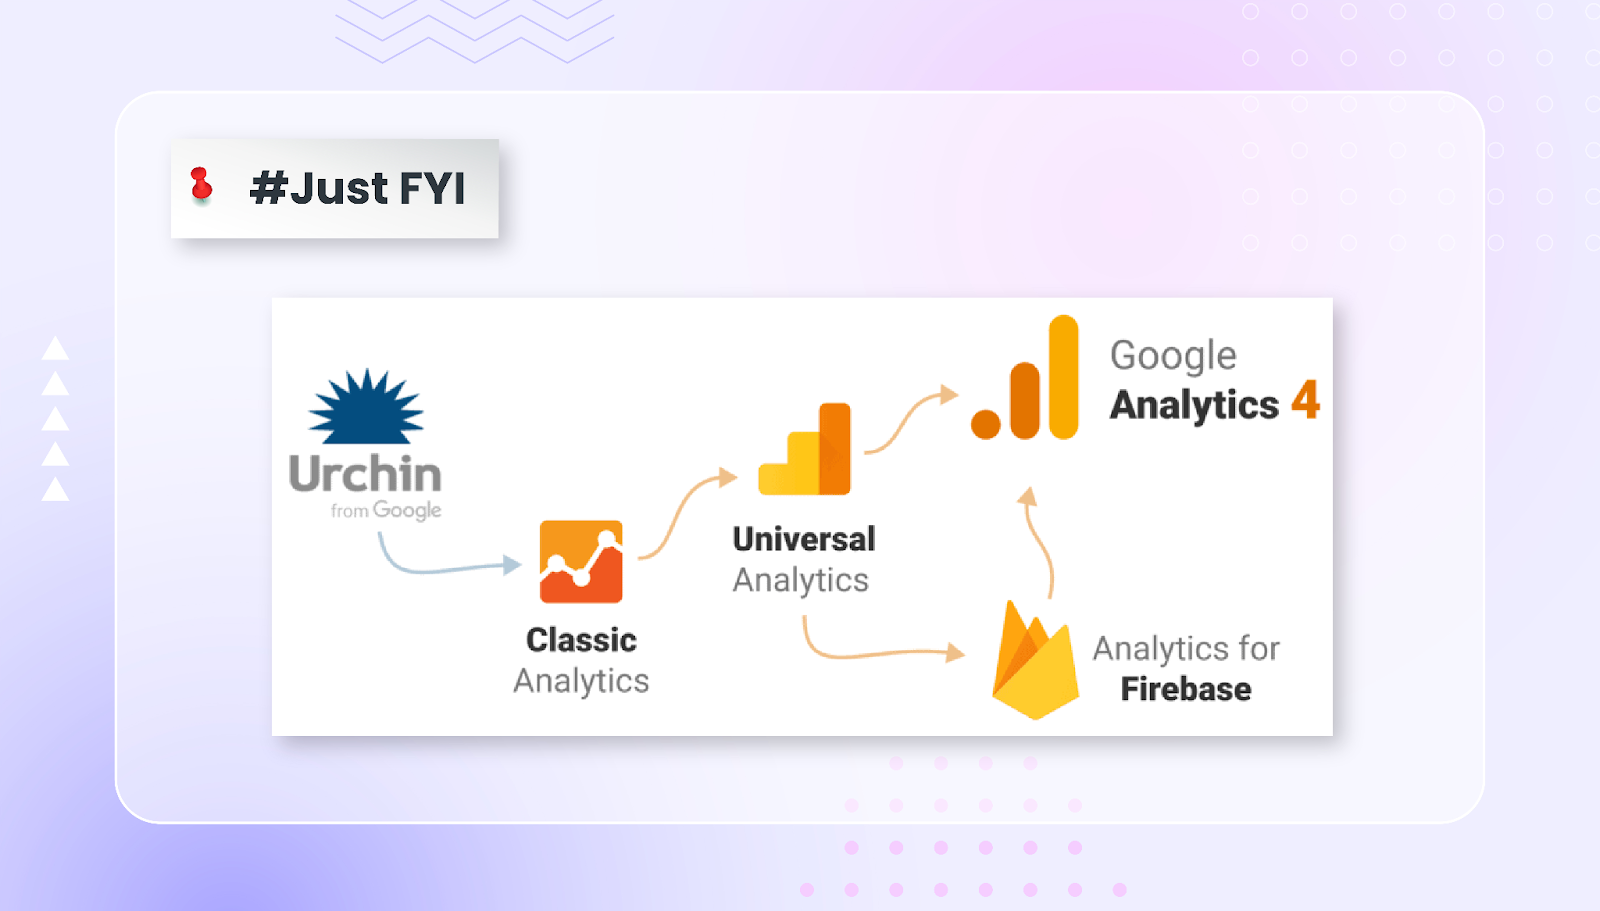
1. Google Analytics
Google Analytics (GA) is the leading eCommerce analytics tool, and over 13.5 Million websites are using it. The latest version, GA4, is free but introduces data sampling after 500,000 sessions.
Use Google Analytics to Improve Your eCommerce Store:
1️⃣ Assessing Traffic Sources and Volume: Evaluate if your marketing strategy is effective.
2️⃣ Monitoring Customer Engagement and Bounce Rates: Identify where visitors drop out of the funnel.
3️⃣ Tracking eCommerce Metrics: Analyze metrics like lifetime value (LTV) and conversion events.
Alternatives to Google Analytics:
➡️ Fathom: A straightforward, cookieless, privacy-focused eCommerce analytics tool.
➡️ Adobe Analytics: A sophisticated analytics and business intelligence platform.
2. riyo.ai
riyo.ai is a user-friendly analytics platform trusted by users worldwide. It’s free plan allows you to track visitor behavior with 4 powerful tools:
Use riyo.ai To Improve the User Experience of the eCommerce Store:
1️⃣ Heatmaps reveal where visitors click, scroll, and hover, helping you optimize
layouts and calls to action (CTAs).
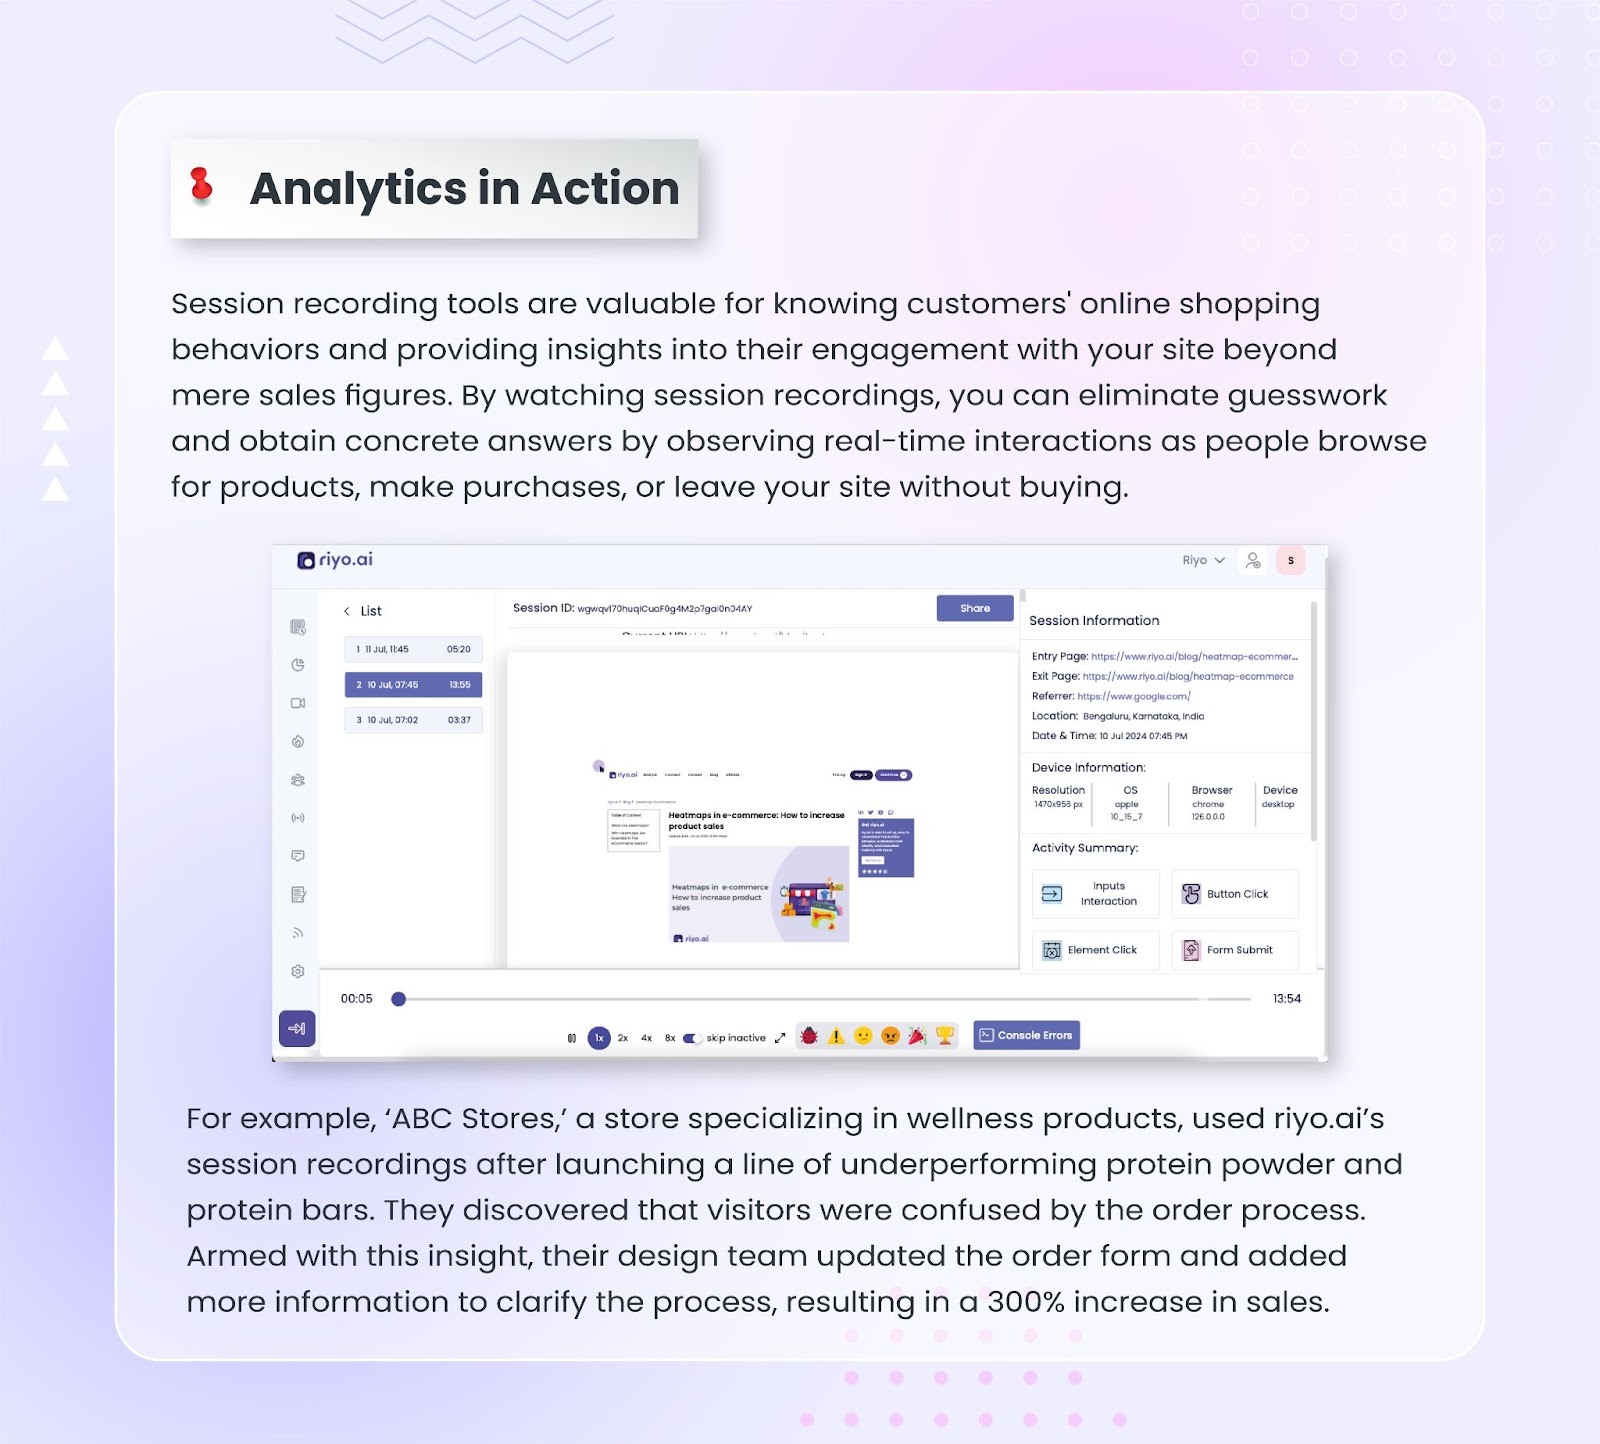
2️⃣ Session recordings let you watch real user interactions, uncovering any friction points that lead to frustration or abandonment.
3️⃣ Surveys and feedback forms help you understand visitor needs and identify areas for improvement.
4️⃣ Live chat helps users resolve their queries or confusions on the spot and improve their experience.
The Benefits of Using riyo.ai:
⏩ Optimize Clicks: See if visitors miss important CTAs with heatmaps.
⏩ Reduce Bounce Rates: Identify pain points causing frustration through recordings.
⏩ Stop Cart Abandonment: Use heatmaps and session recordings to know the painpoints that cause cart abandonment and work on them to increase the conversion rate.
Alternatives to Google Analytics:
➡️ Hotjar: Provides heatmaps, session recording, funnel analytics, and surveys
➡️ Mouseflow: Provides heatmaps, recordings, surveys, and A/B testing
Grow your eCommerce business with the right analytics tools
Use riyo.ai Heatmaps, Session recordings, Feedback forms, Triggers, Live Chat, etc tools to see why shoppers convert or click away
Start with a 14-day free trial3. Shopify Analytics
Shopify Analytics is the integrated eCommerce tool for all 4.5 million Shopify stores. Users on the Basic plan can access most Shopify Analytics reports for free, while advanced and custom reports are available on higher pricing tiers.
Use Shopify Analytics To Improve Your Online Business:
1️⃣ Tracking Key eCommerce Metrics: Monitor metrics like store sessions (traffic), online store conversion rate, average order value, and returning customer rate.
2️⃣ Comparing Sales Channel Performance: Evaluate the performance of different sales channels, including in-person sales, if using the Shopify Point of Sale (POS) app.
3️⃣ Analyzing Visitor Sources: Understand where your visitors are coming from, whether by region or social media source.
Alternatives to Shopify Analytics:
➡️ Better Reports: A premium Shopify app for advanced reporting.
➡️ Analyzify: A premium Shopify app for integrating Google Analytics, Tag Manager, and Google Ads.
Click here to get access to the riyo.ai Shopify Installation guide
4. WooCommerce Analytics
WooCommerce Analytics is the free, open-source reporting and data analysis tool used by over 7 million WordPress websites running WooCommerce. While its functionality focuses on sales analytics, it is highly customizable, and reports can be conveniently accessed within the WordPress dashboard.
Use WooCommerce Analytics to Improve Your eCommerce Store:
1️⃣ Accessing Basic Reports: View and download reports on products, revenue, coupons, taxes, and stock levels.
2️⃣ Customizing Your Dashboard: Customize your dashboard to display your most important metrics at a glance.
3️⃣ Using Advanced Filters: Apply filters to identify your most valuable customer segments.
Alternatives to WooCommerce Analytics:
➡️ WooCommerce Google Analytics: A free plugin extension to integrate Google Analytics with WooCommerce.
➡️ MonsterInsights: A Google Analytics plugin for WordPress.
Read the step-by-step guide and integrate riyo.ai with your WooCommerce store
Click here to get full access to a guide
5. Mixpanel
Mixpanel offers a comprehensive data analytics platform with a free tier that accommodates up to 20 million monthly events. It aggregates data from every customer interaction within your eCommerce business and integrates seamlessly with other tools, providing a unified view of your store’s performance metrics.
Improve Your eCommerce Store with Mixpanel:
1️⃣ Generate Interactive Reports: Create detailed, customizable reports to visualize product analytics and customer insights.
2️⃣ Monitor Key Metrics: Track important eCommerce metrics and KPIs, such as product views and add-to-cart conversions.
3️⃣ Optimize Conversion Funnels: Design custom funnels to pinpoint where users drop off and refine the customer journey to boost conversions.
Alternatives to Mixpanel:
➡️ Glassbox: A platform focused on digital customer experience analytics.
➡️ Amplitude Analytics: A tool tailored for product teams to analyze user behavior.
6. Woopra
Woopra is customer journey and eCommerce analytics software that offers a free plan for tracking up to 500,000 actions per month. It captures data from every customer interaction with your store.
Use Woopra to Improve your eCommerce Store:
1️⃣ Customer Journey Analysis: Track the entire customer journey, from marketing channels to conversions, to identify areas for improvement.
2️⃣ Trend Measurement and Data Segmentation: Analyze trends and segment data to discover valuable customer cohorts.
3️⃣ Real-Time Customer Profiling: Create comprehensive customer profiles across all touchpoints - email campaigns, mobile apps, and live chat, to identify your most engaged customers.
Alternatives to Woopra:
➡️ Pyze: A digital analytics and engagement platform.
➡️ Pendo: A product experience platform.
Grow your eCommerce business with the right analytics tools
Use riyo.ai’s Heatmaps, Recordings, Surveys, and Feedback tools to see why shoppers convert or click away.
Start with a 14-day free trial now7. Kissmetrics
Kissmetrics is a premium analytics solution customized for online businesses with monthly sales ranging from $500,000 to $5 million. Like riyo.ai, Woopra, and Mixpanel, Kissmetrics tracks customer-specific data, allowing you to view actions by individual customers. It starts at $299 per month.
Using Kissmetrics to Boost Your eCommerce Store:
1️⃣ Key Metrics Overview: Quickly view essential store metrics such as total sales, average order value (AOV), and cart-to-purchase conversion rate.
2️⃣ Data Segmentation: Segment data into cohorts to identify common traits among high spenders and understand how you acquired them.
3️⃣ Sales Funnel Analysis: Analyze the sales funnel to identify and address drop-off points in the checkout process.
Alternatives to Kissmetrics:
➡️ Acoustic Insights: Digital marketing experience analytics.
➡️ Qualtrics: Experience management software.
Methods For eCommerce Website Analytics
1. Heatmaps
Overview:
Heatmaps visually represent data, with values depicted by color. They help you understand how users interact with your site by showing where they click, move, and scroll.
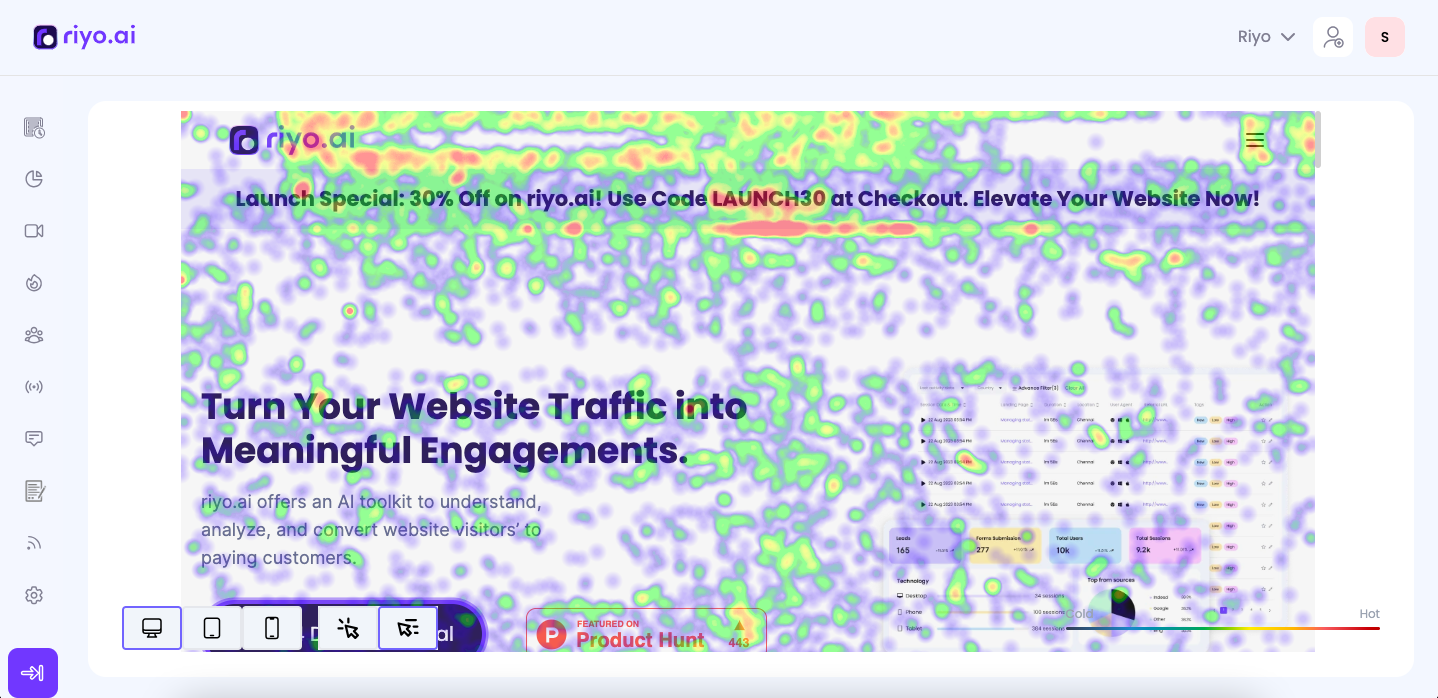
How to Use:
Install a heatmap tool (e.g., riyo.ai, Hotjar, Crazy Egg) on your website.
Set up specific pages to track interactions.
Analyze the heatmap data to see user behavior patterns.
When to Use:
When you want to identify popular areas on a webpage.
To understand which elements attract the most attention.
During the redesign phases, compare old and new versions of pages.
Where to Use:
On high-traffic pages like the homepage, product pages, and checkout pages.
Assess the effectiveness of your calls to action (CTAs) on landing pages.
Who Can Use:
UX/UI designers to optimize layouts.
Marketers to improve CTAs and campaigns.
Product managers to improve user experience.
Benefits:
Identifies hotspots and areas of interest.
Highlights areas that might need redesign or improvement.
Provides visual data that is easy to interpret.
Turn up the heat on your eCommerce site 🔥
Start using riyo.ai Heatmaps today to see what visitors are really doing on your site. Then, prioritize improvements that help you sell more.
Start with a 14-day free trial
2. Session Recordings
Overview:
Session recordings capture user interactions on your site, allowing you to watch real-time user behavior and identify potential issues.
How to Use:
Use tools like riyo.ai, Hotjar, FullStory, or Lucky Orange to record sessions.
Filter recordings by user behavior (e.g., rage clicks, long sessions).
Watch the recordings to understand user actions and frustrations.
When to Use:
When troubleshooting specific user experience issues.
To observe how users navigate your site.
During usability testing phases.
Where to Use:
On critical conversion pages like checkout and product detail pages.
On pages with high bounce or exit rates.
Who Can Use:
UX researchers to identify pain points.
Customer support teams to understand user issues.
Developers to pinpoint and fix bugs.
Benefits:
Provides detailed insights into user behavior.
Helps identify usability issues and bugs.
Can improve the overall user experience by addressing observed problems.
See your eCommerce store through your shoppers’ eyes 👀
Set up session recordings and use the insights to provide an experience no competitor can beat
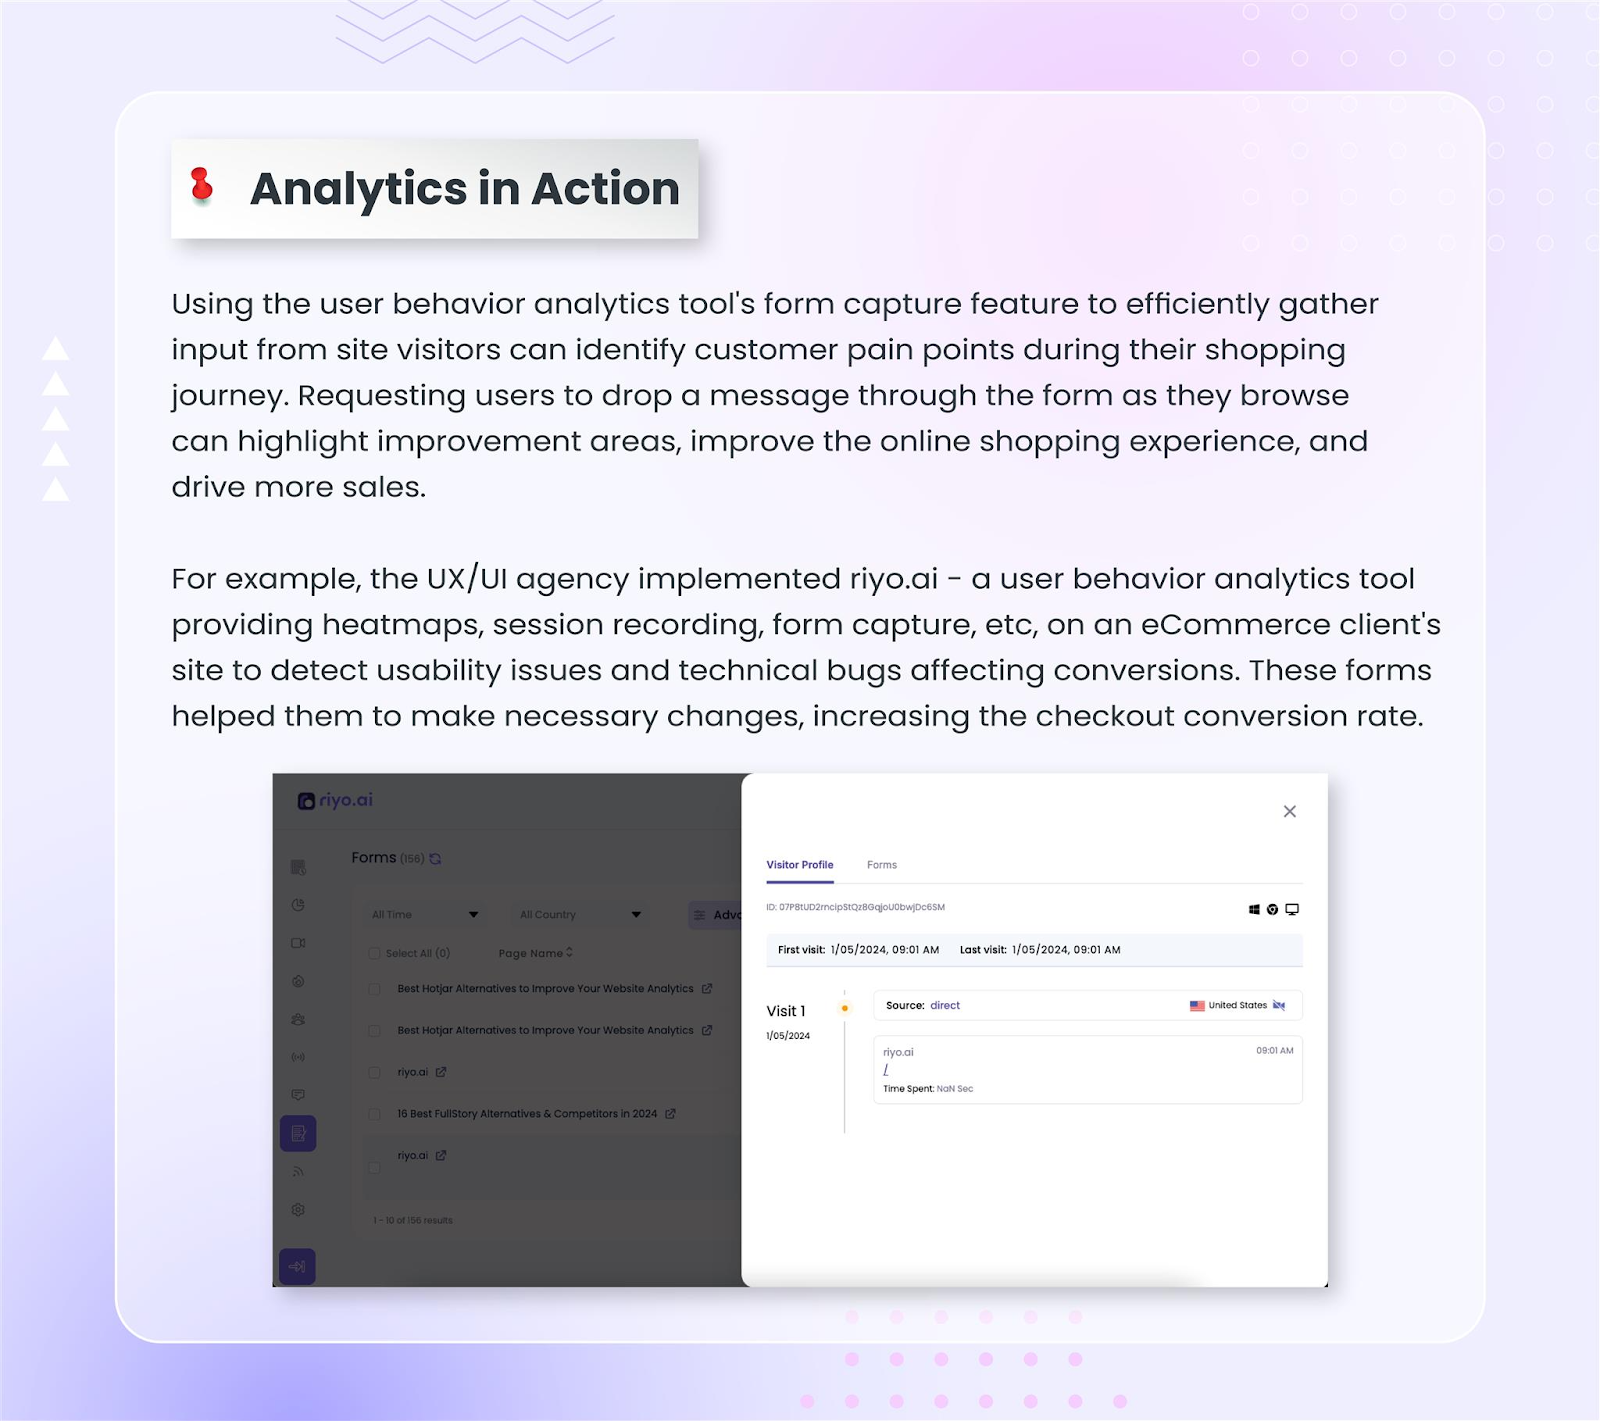
Start with a 14-day free trial3. User Surveys and Feedback Forms
Overview:
User surveys and feedback forms collect direct input from your customers about their experience and satisfaction.
How to Use:
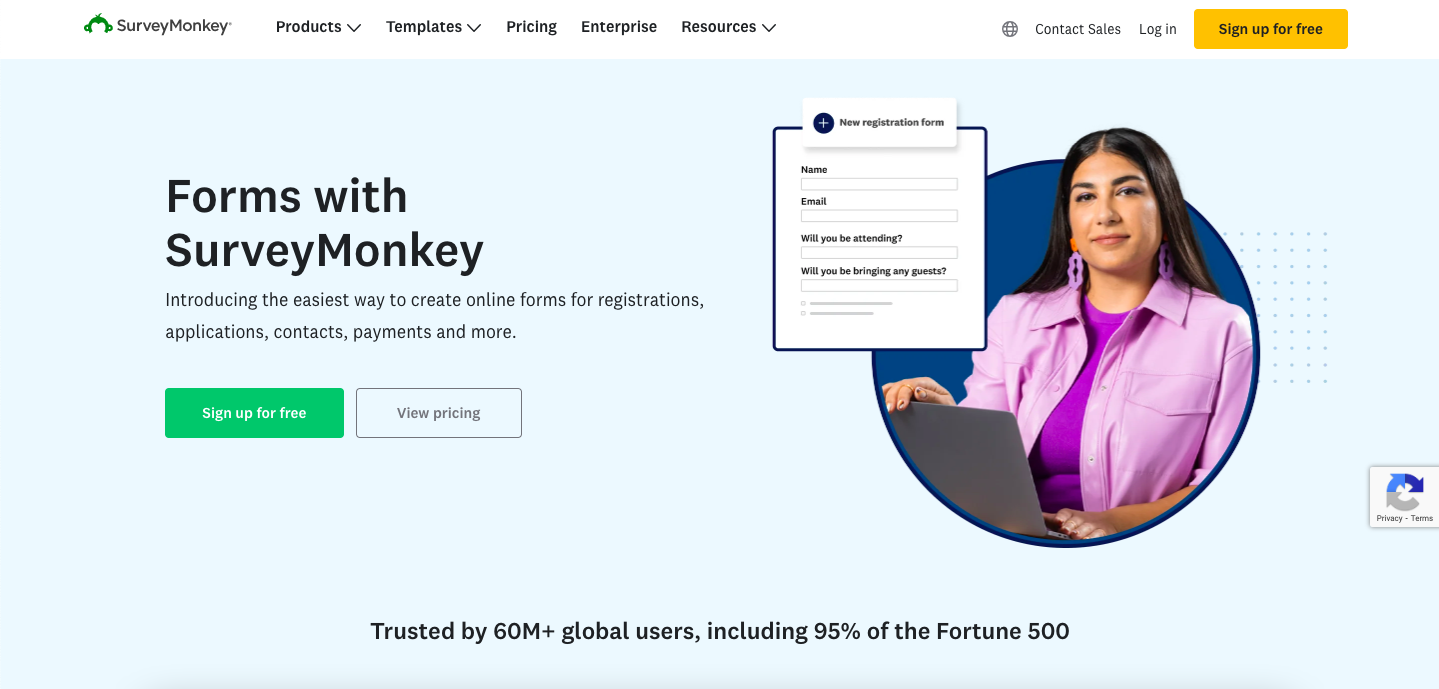
Create surveys using tools like SurveyMonkey, Typeform, or Google Forms.
Link feedback forms on key pages or trigger them after certain actions.
Analyze responses to gain insights into user satisfaction and issues.
When to Use:
When you need qualitative data on user experience.
To gather feedback after a purchase or site interaction.
During product development or site redesign phases.
Where to Use:
On post-purchase pages.
As exit-intent popups on critical pages.
In follow-up emails after customer interactions.
Who Can Use:
Customer experience teams to improve service.
Product teams for feature development.
Marketing teams for campaign adjustments.
Benefits:
Provides direct feedback from users.
Helps prioritize changes based on user needs.
It can know issues that are not visible through quantitative data alone.
4. Funnel Analysis
Overview:
Funnel analysis tracks users' steps to complete a goal on your site, identifying where they drop off in the process.
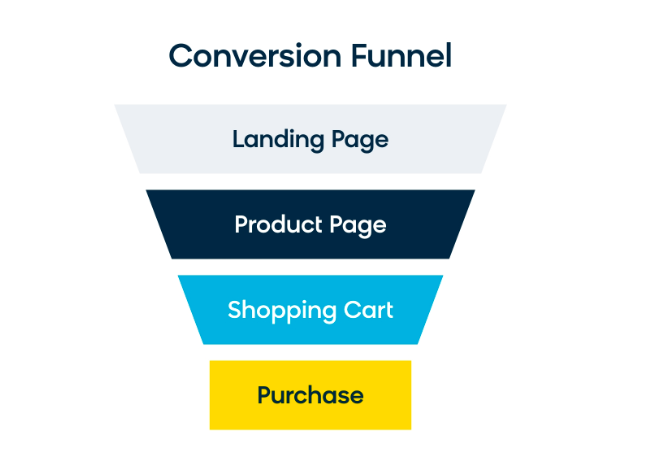
How to Use:
Set up funnels using tools like Google Analytics, Mixpanel, or Kissmetrics.
Define key steps (e.g., landing page > product page > cart > checkout).
Analyze where users drop off and optimize those stages.
When to Use:
To improve conversion rates.
When there are noticeable drop-offs in the sales process.
To identify barriers to completing desired actions.
Where to Use:
In the checkout process.
During account creation or lead generation steps.
On multi-step forms or applications.
Who Can Use:
Marketing teams to optimize conversion paths.
Product managers to improve user flow.
UX designers to improve the user journey.
Benefits:
Identifies specific stages where users abandon the process.
Provides clear steps for optimization.
It can significantly increase conversion rates when optimized.
5. Behavioral Segmentation
Overview:
Behavioral segmentation divides users into groups based on their behaviors, such as purchasing habits or site interactions.
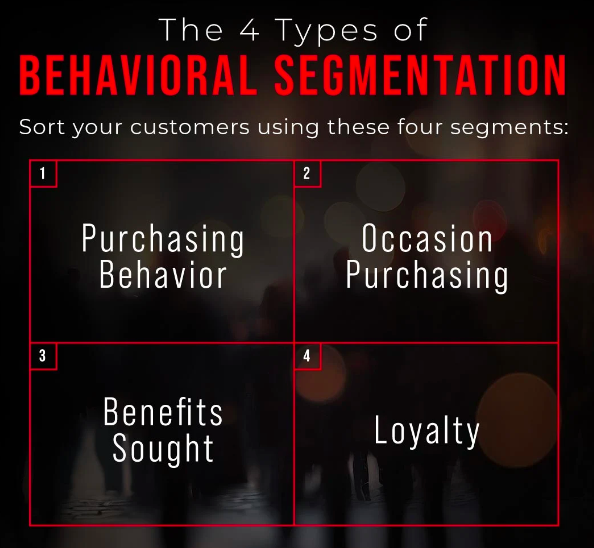
How to Use:
Use analytics tools to segment users based on actions (e.g., frequent buyers, cart abandoners).
Analyze segments to customize marketing and site experiences.
Implement targeted campaigns or site changes for each segment.
When to Use:
When you want to personalize marketing efforts.
To improve engagement and conversion rates.
When identifying high-value customer segments.
Where to Use:
In email marketing campaigns.
On personalized landing pages.
For targeted promotions and offers.
Who Can Use:
Marketing teams for personalized campaigns.
Product managers for targeted features.
Sales teams for focused outreach.
Benefits:
Improves relevance of marketing efforts.
Improves user engagement and satisfaction.
It helps identify and focus on high-value segments.
6. Conversion Rate Optimization (CRO)
Overview:
CRO involves improving your website to increase the percentage of visitors who complete desired actions, such as purchasing.
How to Use:
Conduct A/B testing using tools like Optimizely or VWO.
Implement changes based on user feedback and analytics data.
Monitor and iterate on changes to continually improve conversion rates.
When to Use:
To boost sales and revenue.
When experiencing low conversion rates.
During site redesign or marketing campaign rollouts.
Where to Use:
On landing pages and product pages.
In the checkout process.
On high-traffic pages.
Who Can Use:
UX/UI designers to optimize page elements.
Marketing teams to refine CTAs and content.
Product managers to enhance the overall user journey.
Benefits:
Increases sales and revenue.
Improves user satisfaction and experience.
Provides measurable results from testing and optimization.
7. Real-Time Analytics
Overview:
Real-time analytics provides immediate data on user activity as it happens, allowing for quick decision-making and response. Google analytics is one of the most popular tool to use for real-time analytics.
How to Use:
Use tools like Google Analytics, Mixpanel, or Woopra for real-time data.
Monitor key metrics and user activity in real-time dashboards.
Respond promptly to trends, issues, or opportunities as they arise.
When to Use:
During high-traffic events or promotions.
To monitor site performance and user behavior live.
When launching new products or features.
Where to Use:
On high-traffic eCommerce sites.
During flash sales or limited-time offers.
When rolling out significant site changes.
Who Can Use:
Marketing teams to monitor campaign performance.
Customer support to address issues promptly.
IT teams to ensure site stability and performance.
Benefits:
Enables immediate response to user behavior.
Helps capitalize on real-time trends and opportunities.
Ensures site performance and user experience are maintained.
Fix your eCommerce website analysis with a user-driven approach
Sign up for a free riyo.ai trial and learn how to make the right changes for your customers.
Start NowFAQs
(1) How to analyze eCommerce data?
To analyze eCommerce data, define key metrics like conversion rates, average order value, and customer lifetime value. You can use analytics tools like Google Analytics, riyo.ai, Hotjar, or Mixpanel to collect and visualize user data. Conduct regular audits, segment your audience, and perform funnel analysis to identify areas for improvement. Combining quantitative data with qualitative insights from user feedback can provide a comprehensive view of your website’s performance.
(2) Which tool is best for data analysis?
The best tool for data analysis depends on your specific needs. Google Analytics is widely used for tracking overall web performance, while riyo.ai offers great insights through heatmaps and session recordings. Mixpanel excels in tracking user interactions and building custom funnels. For a comprehensive approach, using a combination of these tools can provide the best results.
(3) What is the application of analytics in eCommerce?
Analytics in eCommerce is used to understand customer behavior, optimize user experience, and improve conversion rates. It helps track sales performance, identify popular products, analyze marketing campaign effectiveness, and personalize customer interactions. Businesses can make data-driven decisions to enhance overall performance and profitability by using analytics.
(4) How do I install riyo.ai in various eCommerce platforms?
To track eCommerce in riyo.ai, follow these steps:
- Sign in to your riyo.ai account and select the appropriate property.
- Click on the tracking code
- Copy the script
- Visit the eCommerce platform’s dashboard, and click on the edit code
- Paste the code there
- Click on save and apply changes
Note: Each eCommerce platform is different, and the installation process is also different, so we posted installation guide videos for our users on our YouTube channel, which you can visit to learn more about.
Visit: https://www.youtube.com/@riyoai


Tapan Patel- BDM
As the head of sales & marketing, Tapan has expertise in the execution and planning of business growth strategies aligning with marketing trends. Tapan has over 10+ years of experience in IT marketing for creating growth strategies and managing sales.
Get riyo.ai
riyo.ai is easy to set up, easy to understand. Track visitor behavior, understand their identity, and close deals instantly with riyo.ai.
Get Update
Get timely updates on new features, offers, packages, and specially curated companies generation tips and tricks directly sent to your inbox.